Put your marketing and social media reports on autopilot!
No more spreadsheets or calculations! No more wasting hours collecting and organizing data from different social media pages!
With mLabs Analytics, creating marketing reports has become much faster and easier!
We don’t need your card info. We don’t send Spam.
Try it free for 14 days. 😉
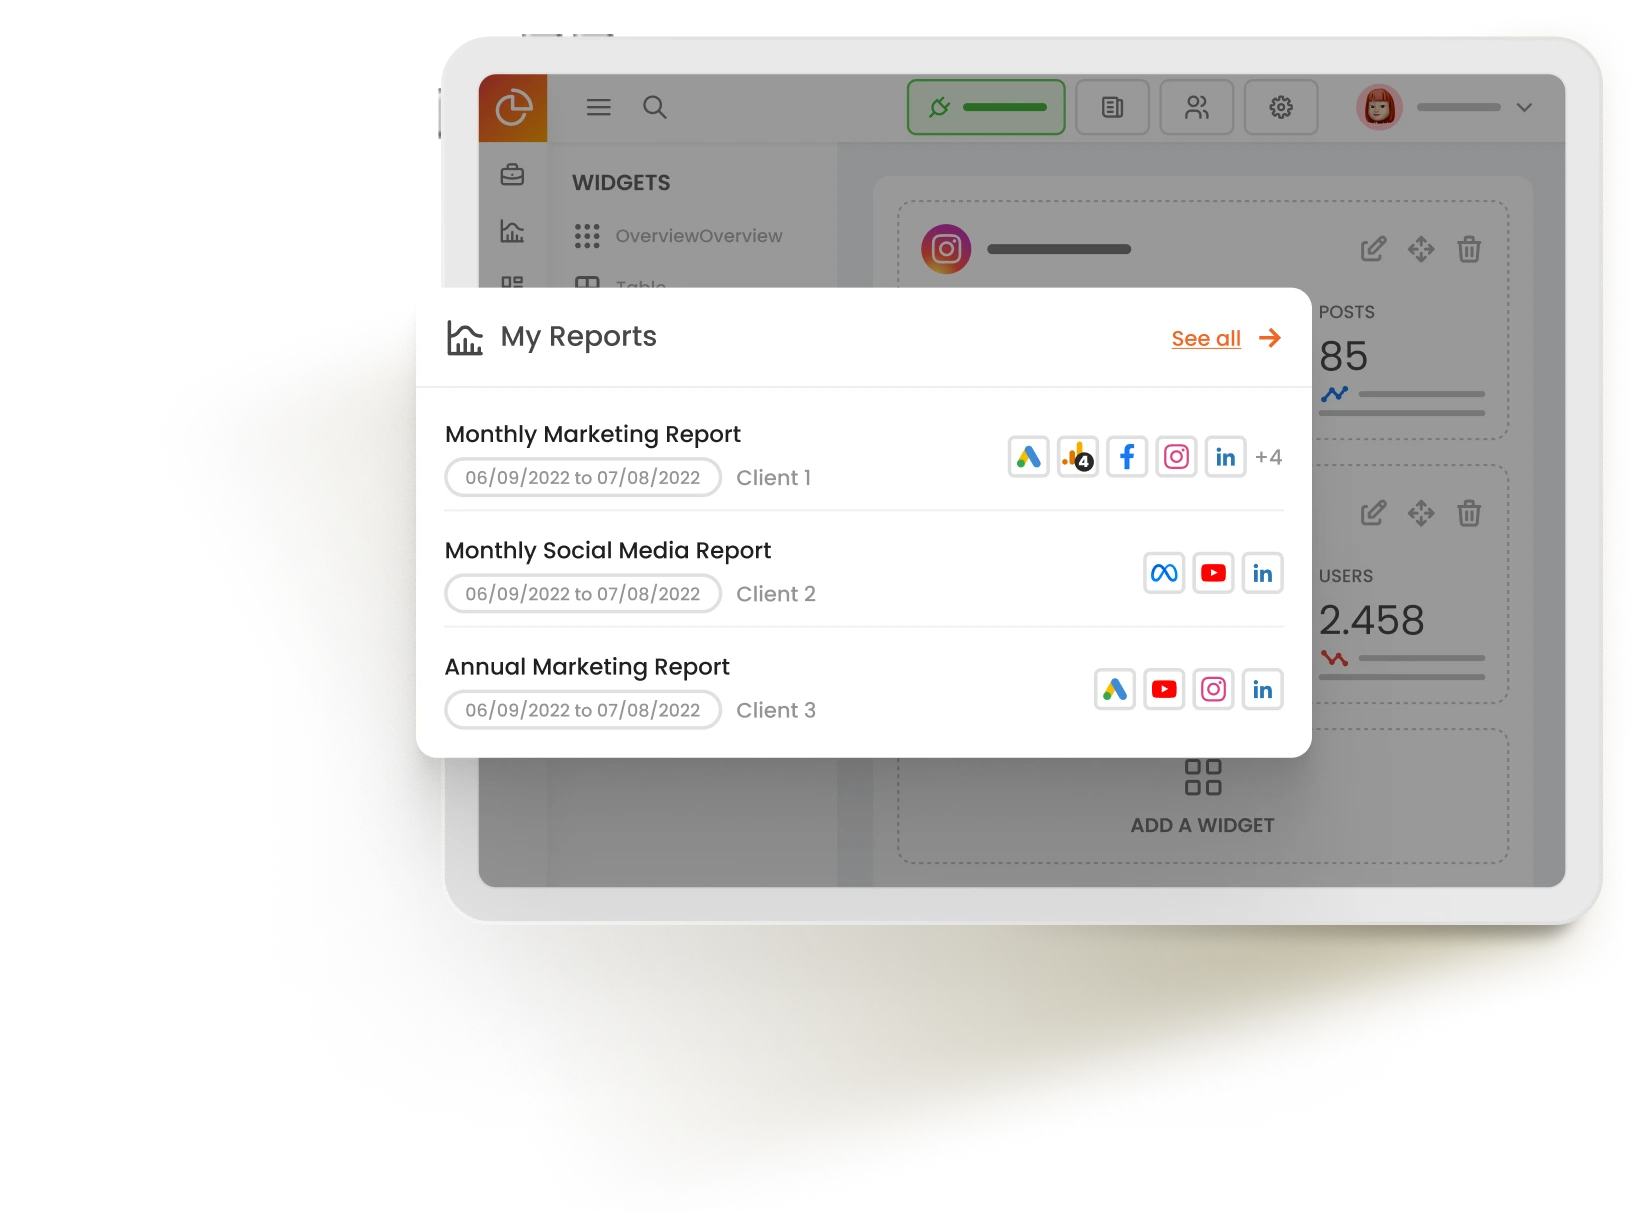
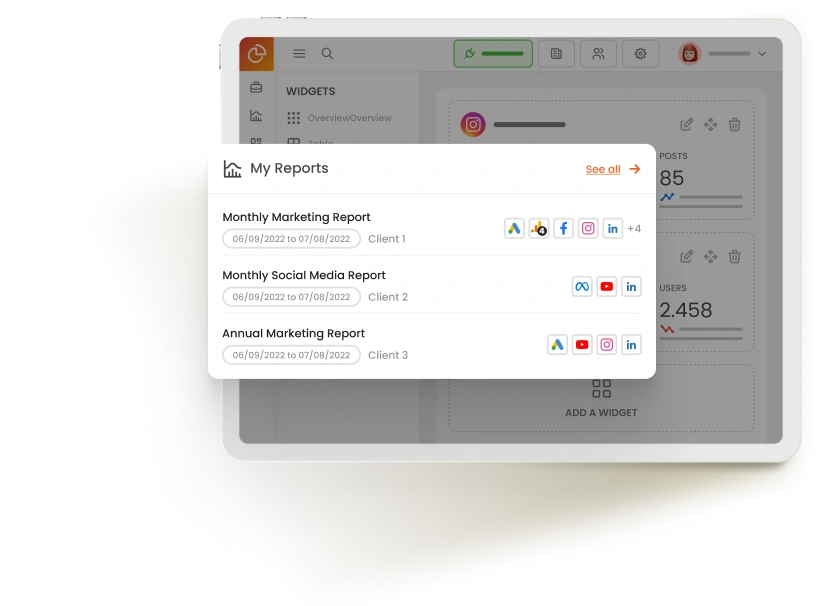
Generate complete reports in seconds and schedule recurrent sending!
Connect the main marketing channels in mLabs Analytics, choose one of our report templates, customize it with your preferences and leave the rest to us!
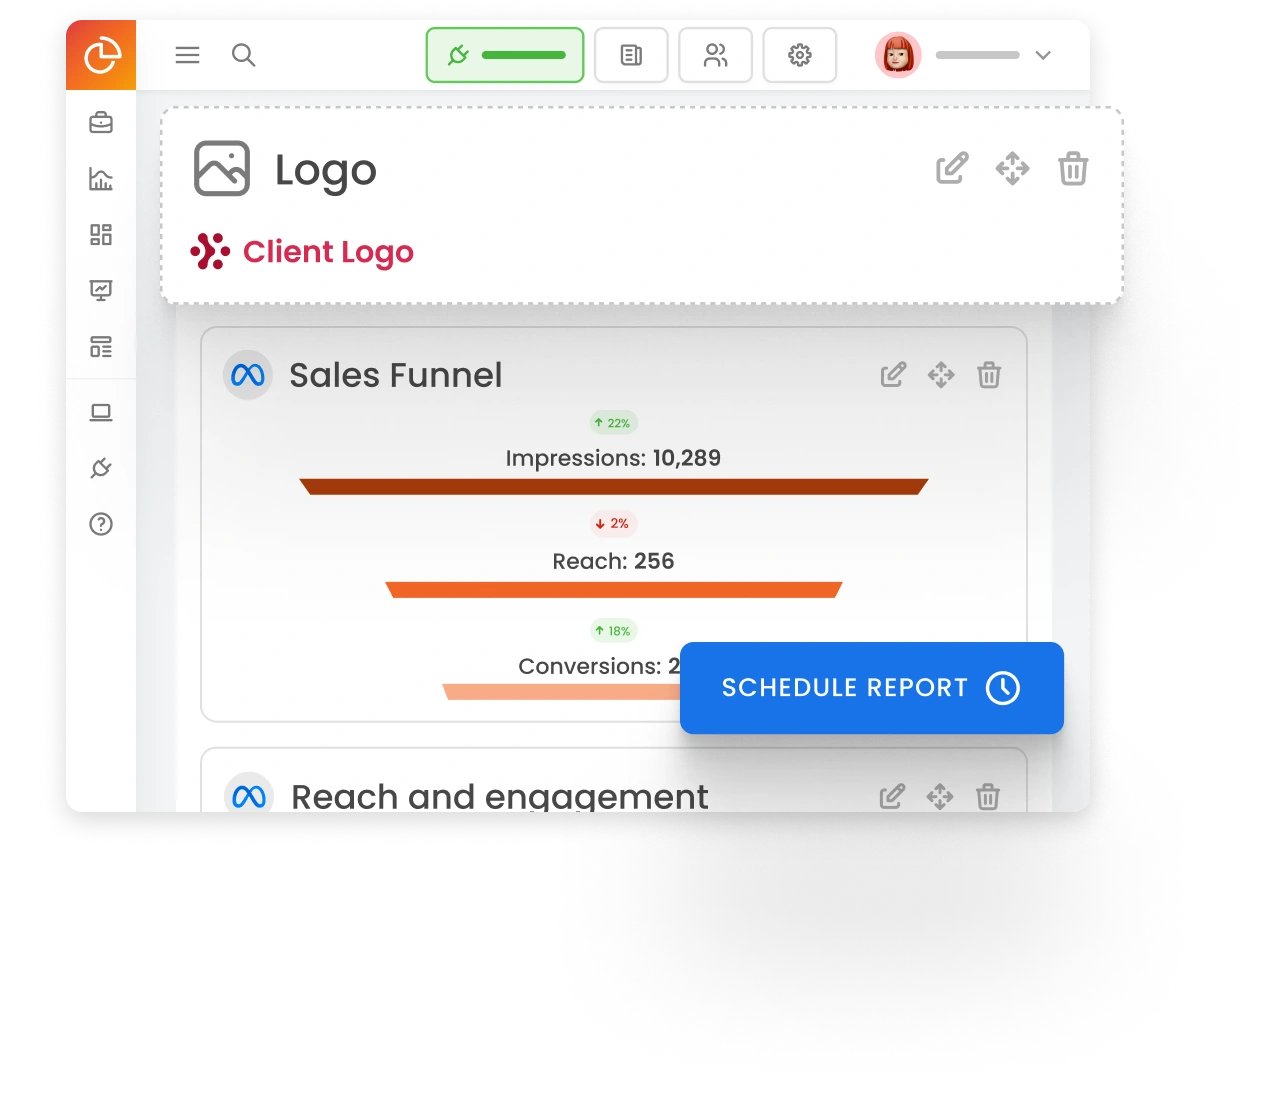
Then, just schedule the recurrent sending, indicating the frequency and who should receive the report by e-mail. It’s that simple!
You can also download your report in PDF format or create a shareable link to send the report through WhatsApp.
Boost results by simplifying data analysis
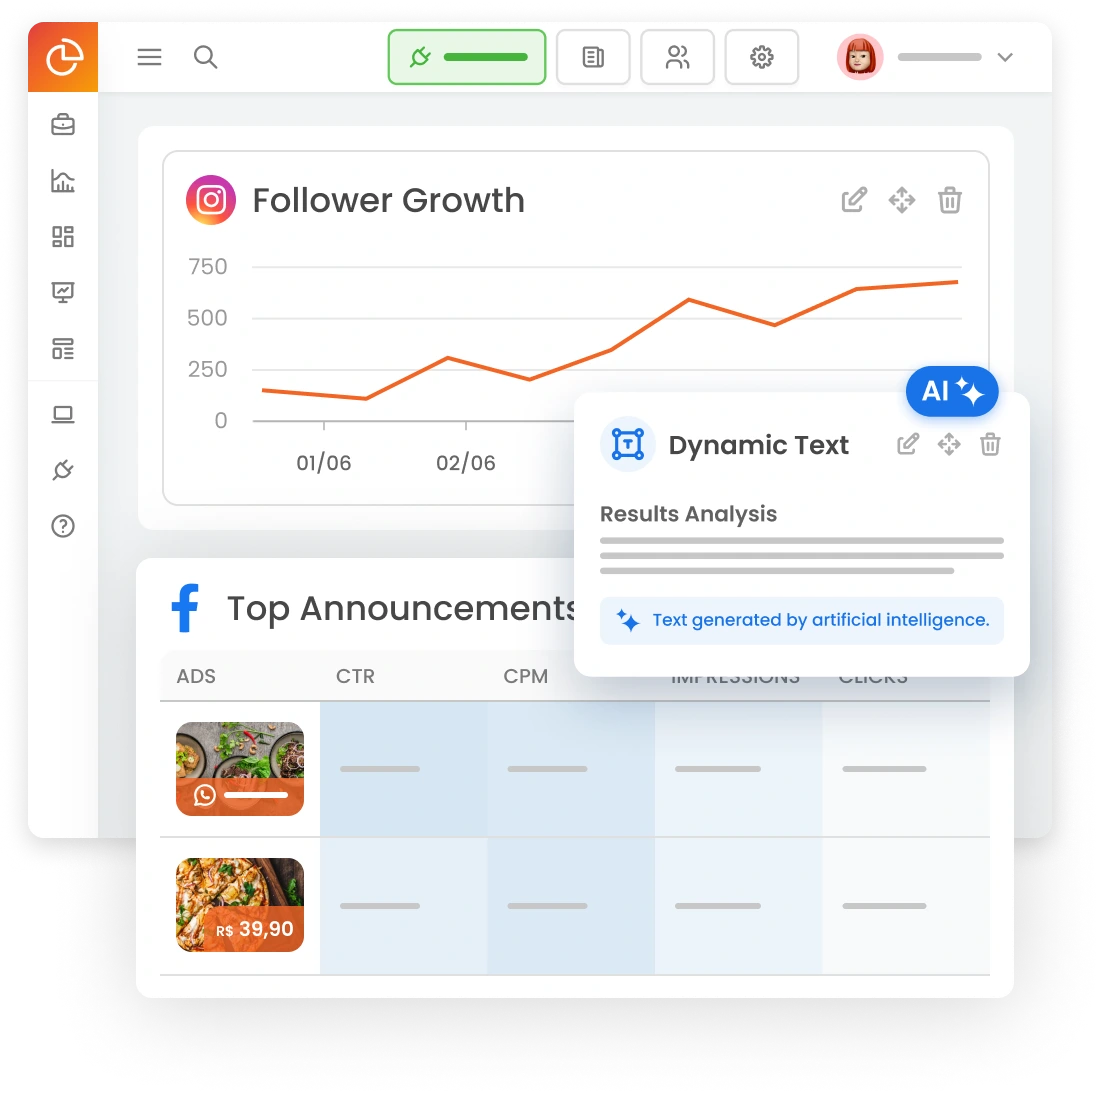
AI-powered analyses suggest insights based on the selected metrics. The combination of charts and tables from our report templates will help you analyze marketing campaign results, make faster decisions, and optimize based on data.
With mLabs Analytics, you can track follower growth, reach, and engagement across different media channels, analyze top-performing ad campaigns, monitor costs, understand traffic results, and much more!
Generate complete reports in seconds and schedule recurrent sending!

Connect the main marketing channels in mLabs Analytics, choose one of our report templates, customize it with your preferences and leave the rest to us!
Then, just schedule the recurrent sending, indicating the frequency and who should receive the report by e-mail. It’s that simple!
You can also download your report in PDF format or create a shareable link to send the report through WhatsApp.
Boost results by simplifying data analysis

AI-powered analyses suggest insights based on the selected metrics. The combination of charts and tables from our report templates will help you analyze marketing campaign results, make faster decisions, and optimize based on data.
With mLabs Analytics, you can track follower growth, reach, and engagement across different media channels, analyze top-performing ad campaigns, monitor costs, understand traffic results, and much more!
Create unique reports with numerous customization features
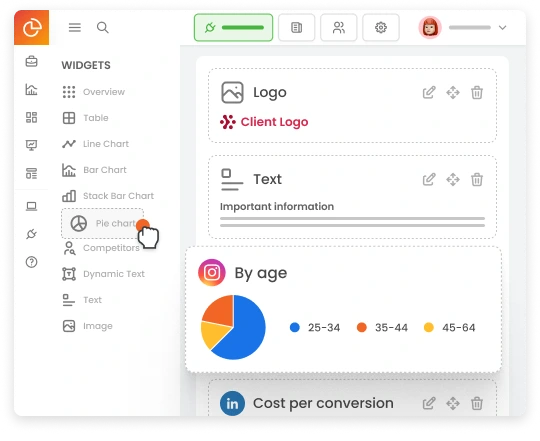
In addition to allowing you to present all possible metrics and dimensions of each social media page, here you can customize reports generated from one of our templates or create your own report and template from scratch!
Enrich your reports and dashboards with custom metrics
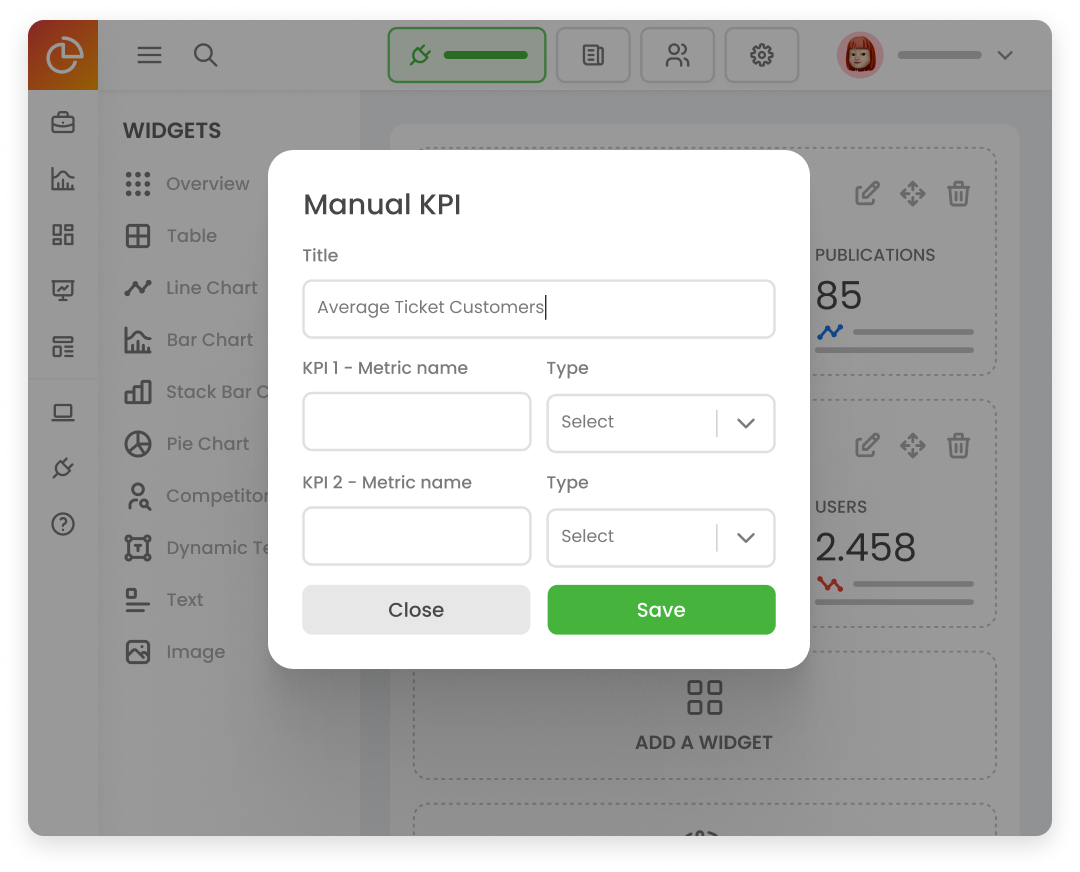
In addition to the data automatically collected by mLabs Analytics, you can supplement your reports and dashboards with your own data.
Manual KPI is a feature that allows you to add the metrics you wish to the report!
You can also use spreadsheet integration to create custom charts from your own data by importing your CSV files.
Create unique reports with numerous customization features
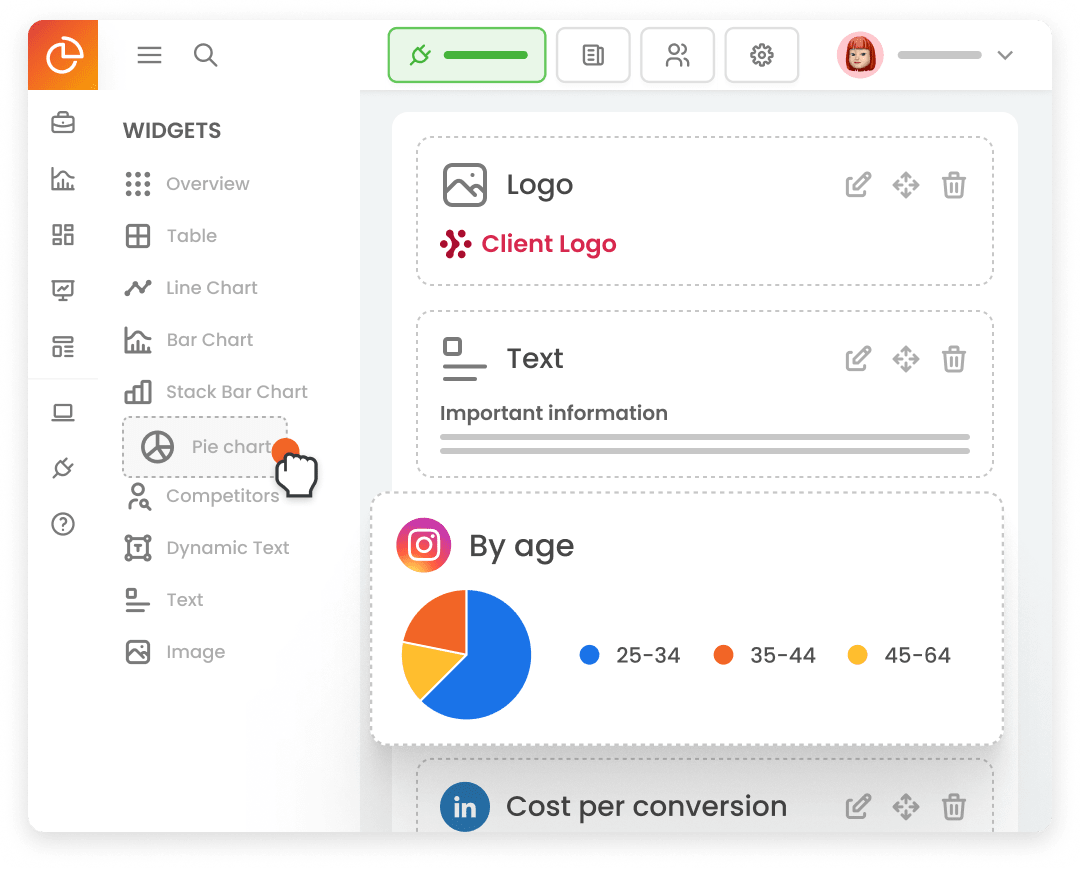
In addition to allowing you to present all possible metrics and dimensions of each social media page, here you can customize reports generated from one of our templates or create your own report and template from scratch!

Enrich your reports and dashboards with custom metrics
In addition to the data automatically collected by mLabs Analytics, you can supplement your reports and dashboards with your own data.
Manual KPI is a feature that allows you to add the metrics you wish to the report!
You can also use spreadsheet integration to create custom charts from your own data by importing your CSV files.

14 days of free trial
Take advantage and test all the mLabs Analytics resources with unlimited users, scheduling and reports!
14 days of free trial
Take advantage and test all the mLabs Analytics resources with unlimited users, scheduling and reports!
Official integrations:

We don’t need your card info. We don’t send Spam.