MLABS DASHGOO IS NOW MLABS ANALYTICS. The reporting and dashboard platform you already know – only better!

Have all your marketing channel metrics in one place!

With mLabs Analytics, you simplify your report creating and sending routine by centralizing multiple social media pages on the same platform!

Create reports and dashboards with all the key performance metrics and indicators from Instagram, Facebook, Meta Ads, Google Ads, Google Analytics 4, TikTok, TikTok Ads, LinkedIn, LinkedIn Ads, YouTube, Google My Business and RD Station!

We don’t need your card info. We don’t send Spam.
Try it free for 14 days. 😉
mLabs Analytics Integrations: reports from multiple channels! 1
mLabs Analytics Integrations: reports from multiple channels! 2
mLabs Analytics Integrations: reports from multiple channels! 3
mLabs Analytics Integrations: reports from multiple channels! 4
mLabs Analytics Integrations: reports from multiple channels! 5
mLabs Analytics Integrations: reports from multiple channels! 6
mLabs Analytics Integrations: reports from multiple channels! 7
mLabs Analytics Integrations: reports from multiple channels! 8
mLabs Analytics Integrations: reports from multiple channels! 9
mLabs Analytics Integrations: reports from multiple channels! 10
Various graphics with metrics from different marketing channels, within mLabs Abalytics. Various graphics with metrics from different marketing channels, within mLabs Analytics. Various graphics with metrics from different marketing channels, within mLabs Analytics. Various graphics with metrics from different marketing channels, within mLabs Analytics. Various graphics with metrics from different marketing channels, within mLabs Analytics. Various graphics with metrics from different marketing channels, within mLabs Analytics. Various graphics with metrics from different marketing channels, within mLabs Analytics. Various graphics with metrics from different marketing channels, within mLabs Analytics. Various graphics with metrics from different marketing channels, within mLabs Analytics. Various graphics with metrics from different marketing channels, within mLabs Analytics.
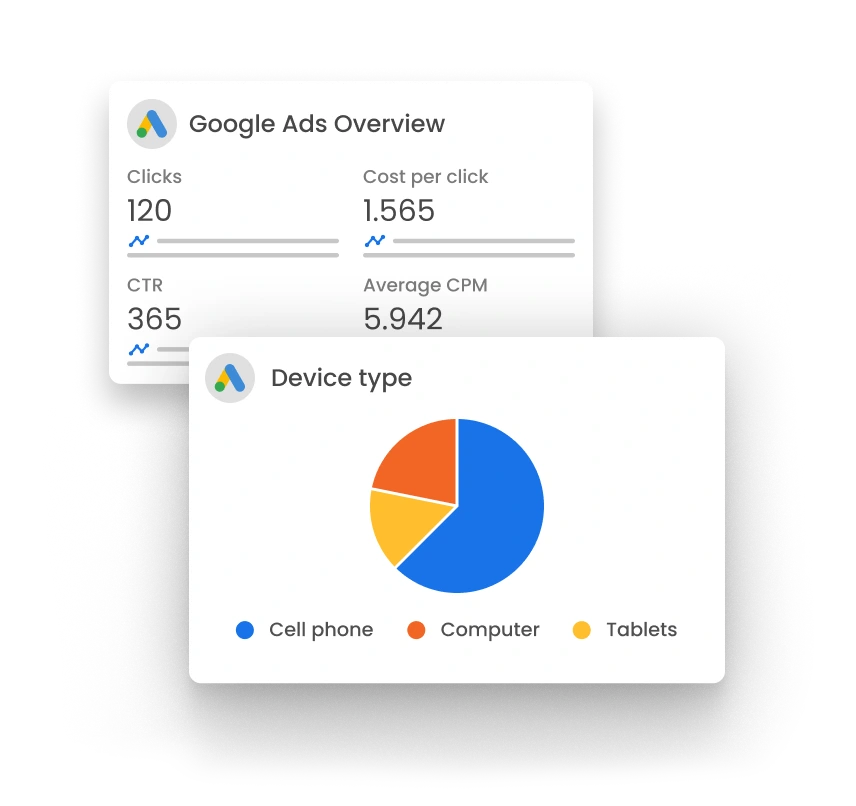
Google Ads overview, graph of top Instagram posts, and graph of Followers versus Engagement Rate on Instagram.

Reports and Dashboards with everything you need to monitor!

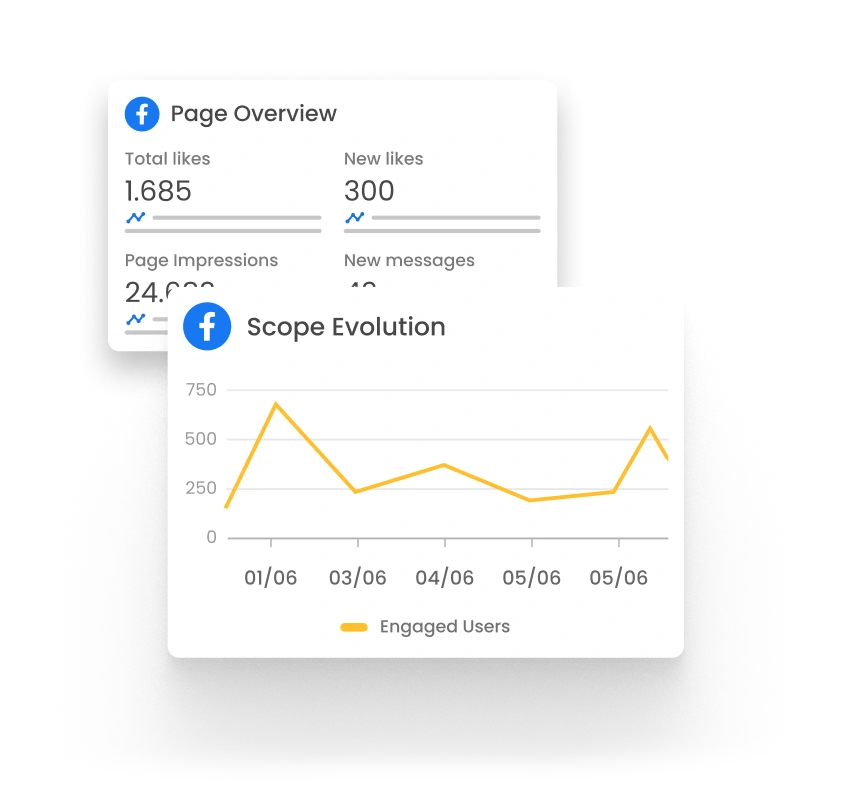
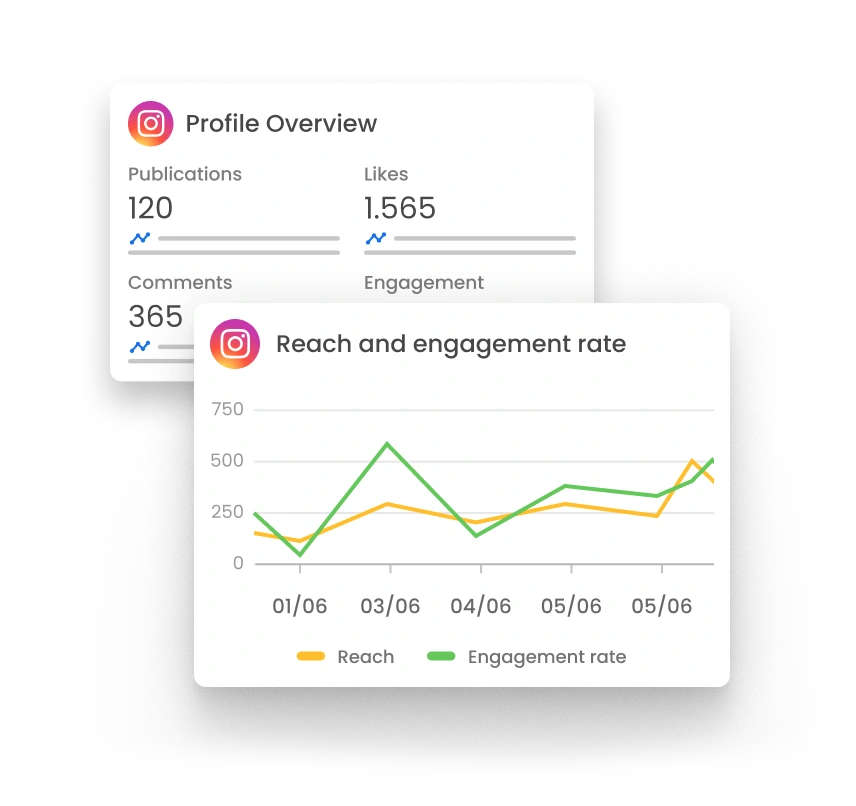
Analyze and monitor the reach and engagement of posts, track the growth of channels, understand the profile of followers and see your best publications, hashtags and more!

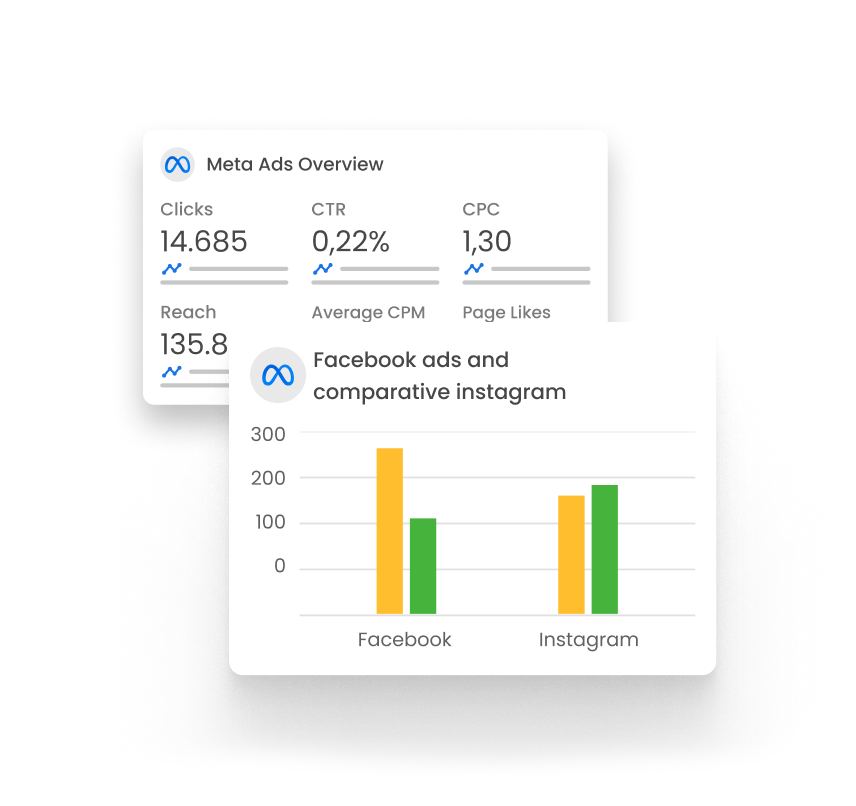
Take advantage of mLabs Analytics to monitor your campaigns and generate paid social media reports! Analyze costs, CTR, CPM, CPC and make optimizations based on data that you access in just a few clicks.

Reports and Dashboards with everything you need to monitor!
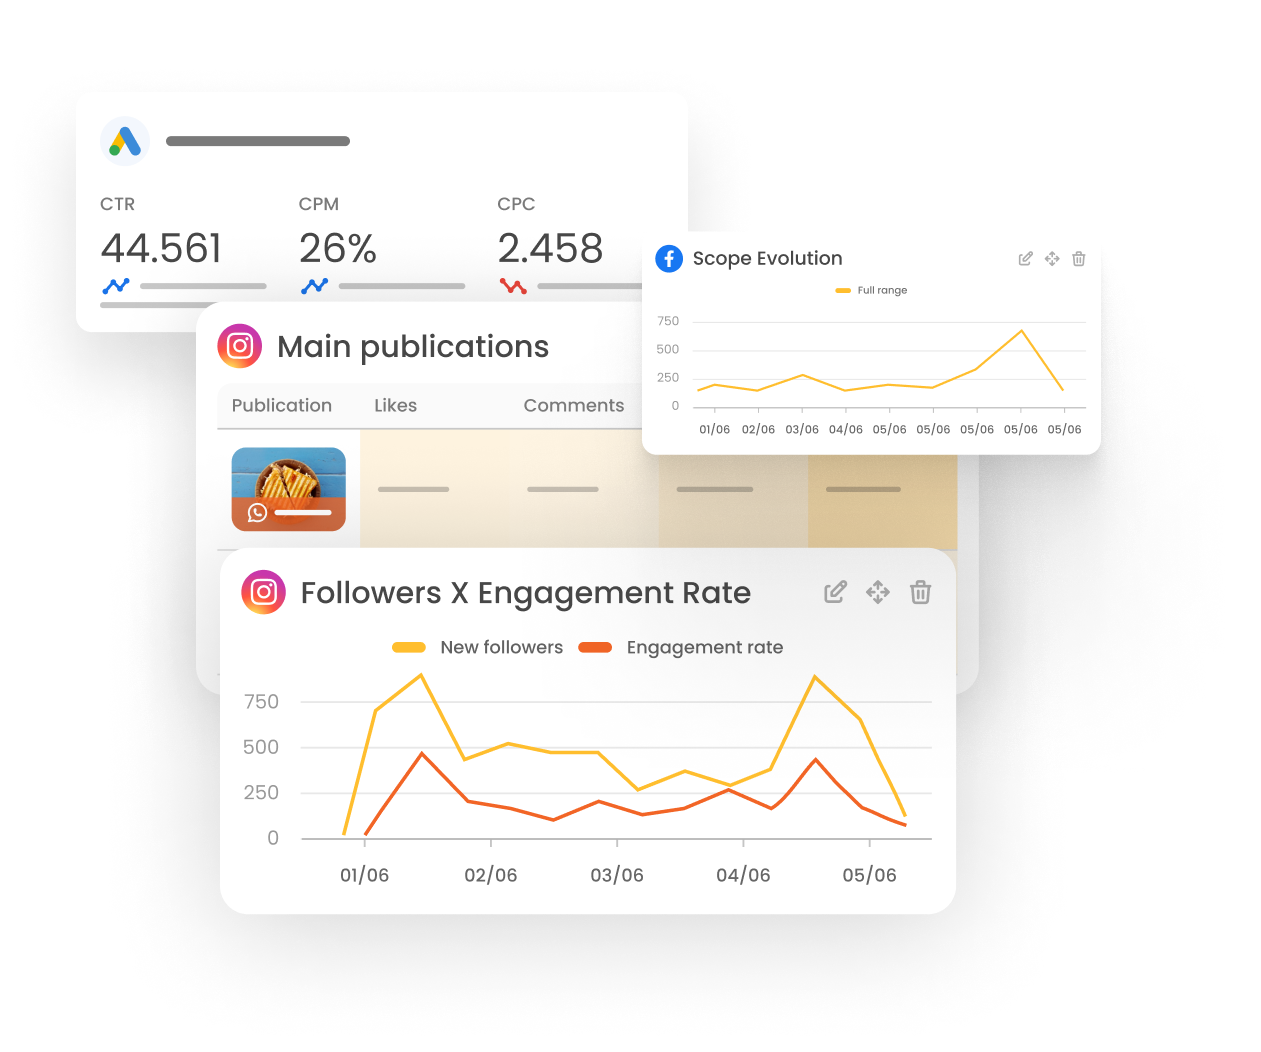
Google Ads overview, graph of top Instagram posts, and graph of Followers versus Engagement Rate on Instagram.

Analyze and monitor the reach and engagement of posts, track the growth of channels, understand the profile of followers and see your best publications, hashtags and more!

Take advantage of mLabs Analytics to monitor your campaigns and generate paid social media reports! Analyze costs, CTR, CPM, CPC and make optimizations based on data that you access in just a few clicks.

All the metrics and indicators you need to track are here!

Official integrations
Impressions ReachResponses and OutputsTaps forward and taps back
Reach ReproductionsLikes + average per post Comments, shares, saved Engagement + rate + average per post Total interactions
Total reach (organic + paid) Started Following Total impressions (organic + paid) Interactions (comments, likes, saved posts) Average Post Engagement
Followers: total number, new per day, gender and age Hashtags (interactions)
Official integrations
Unique, Paid Unique and Unique Page Impressions Viral Page, Paid Page and Organic Page Impressions Reactions Like Total, New Likes and New Unlikes Likes by City and Country Comments + Shares + Likes Views Page Followers and Daily Page Follows Reactions Total Page Actions
Post Clicks Unique Post Impressions + Post Impressions Post Video Views Reels Play Count Comments Shares
Official integrations
Reach Impressions Clicks, Audience Network, Link Clicks and Unique Clicks Total Spend and by Audience Network CPC CTR ROAS Conversion Value Leads Cost by conversation started
Frequency Purchases Messaging Conversation Started Cost per Lead, per Engagement and per RSVP Video Views
Official integrations
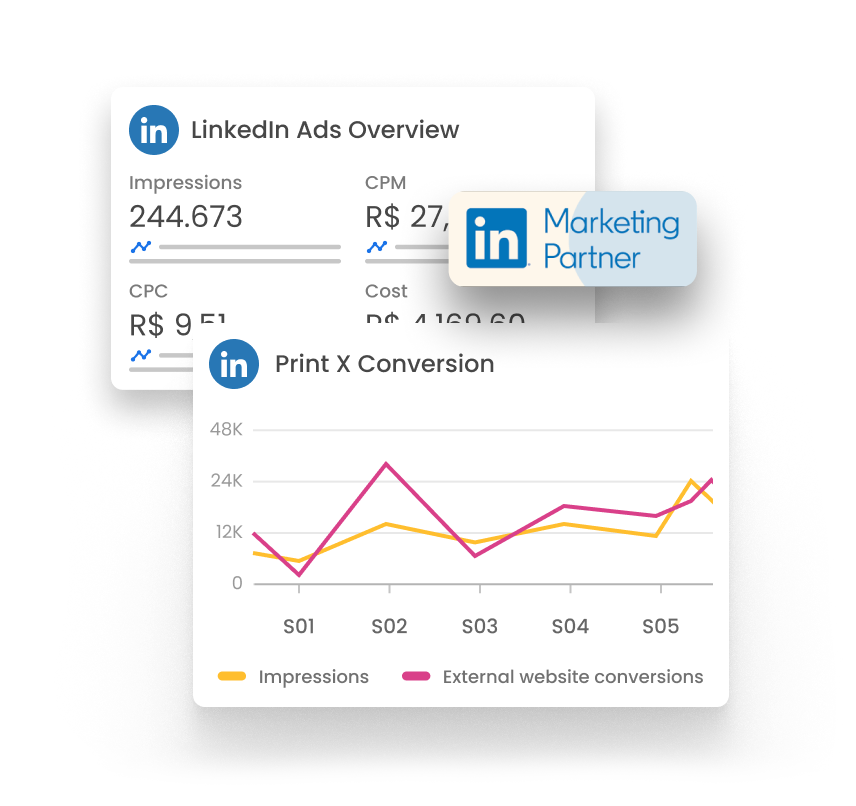
Total visitors, by Sector, Seniority, Role, Country, and Geolocation Total Followers and New Followers Impressions Clicks Comments Shares Page Views Total Reactions Engagement Rate
Published on Comments Reactions Total reactions
Cost CPM CTR Conversions ROAS Sends Open Rate Leads
Official integrations
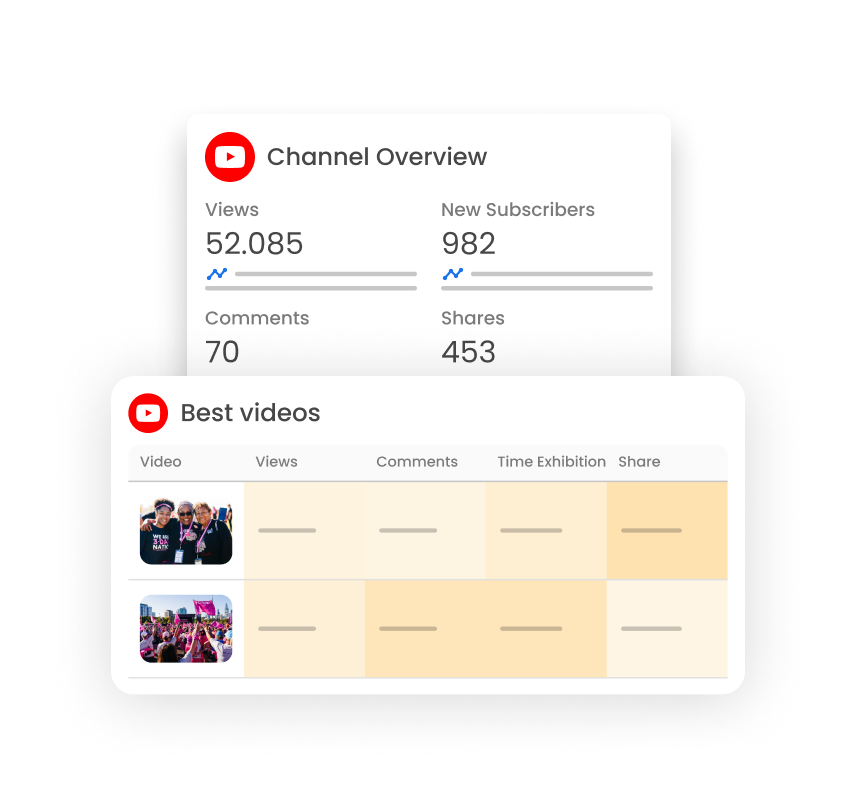
Subscribers New Subscribers Lost Subscribers Views Average View Duration Average View Percentage
Exhibition Time Comments Shares Likes Dislikes
Official integrations
Clicks CTR CPC CPM Conversions
ROAS Engagements Interactions Share of impressions Views
Official integrations
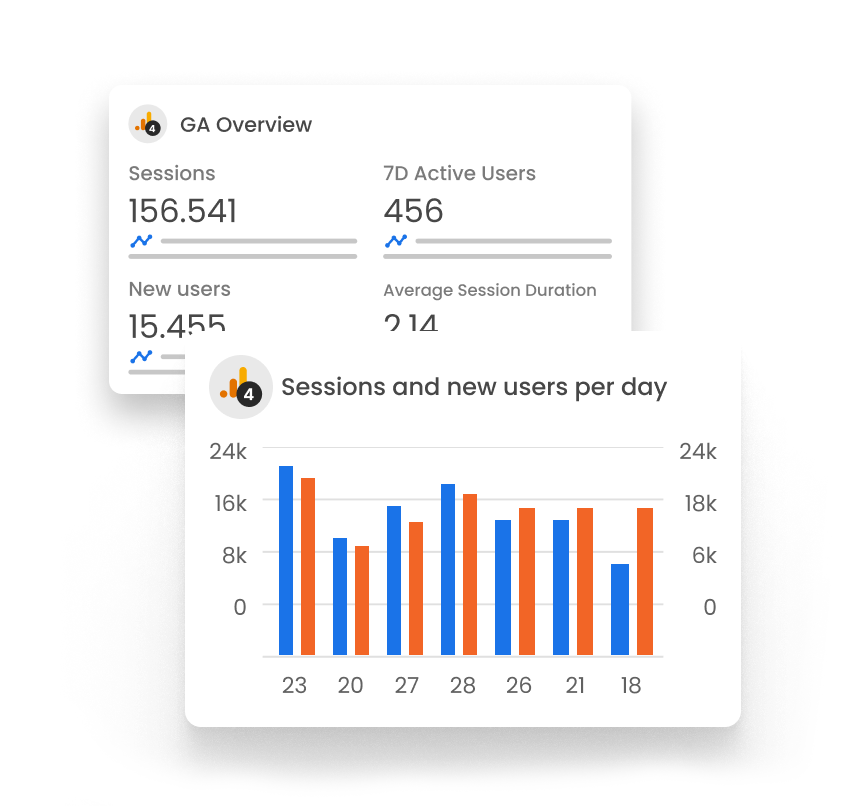
Active Users Total Users New Users Add to carts Checkouts Ads Clicks Ads Cost Key Events
Event Value Total revenue Average purchase revenue Sessions Engaged Sessions ROAS Views
Official integrations
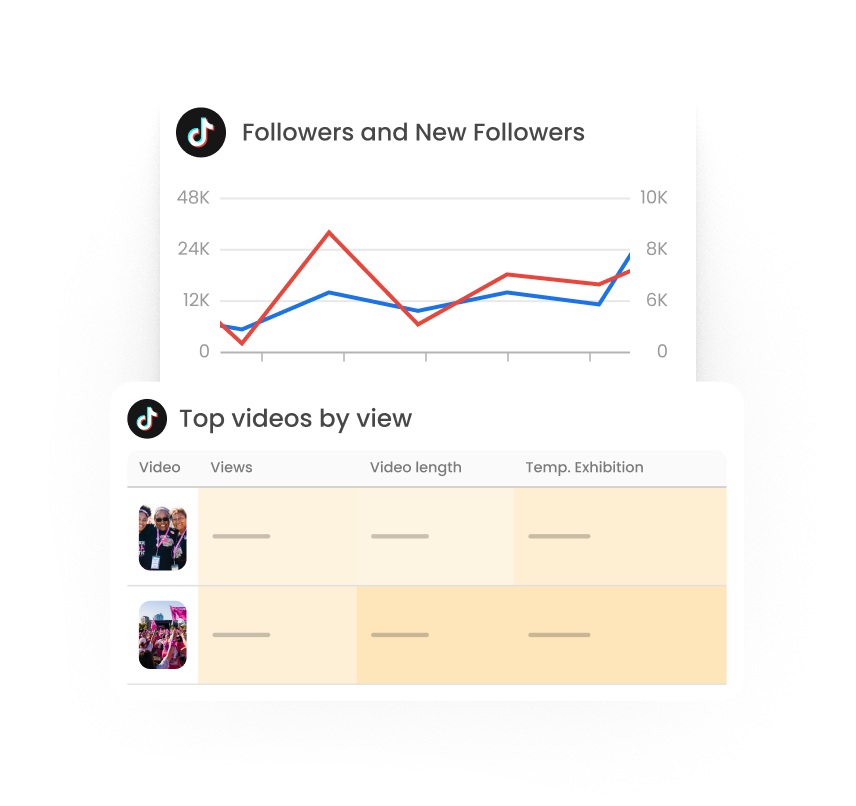
Followers and New Followers Gender and Country/region of followers Comments Shares Likes Posts Video and Profile views Total Interactions Average Interactions per Post Average Views per Post
Video Duration Total time and average time watched Views Interactions Traffic Source: For You, Followers, Hashtags, Sound, Profile, Search
Visits and Paid Profile Visit Rate Paid Likes, Comments, Shares and Followers Video Views Average Watch Time per video view and per person CPC CPM Impressions and Raw Impressions CTR Conversions and Real-Time Conversions CPA CVR (Clicks) CVR (Impressions) Results and Real-time Result CPR Result Rate and Real-time results Rate
Official integrations
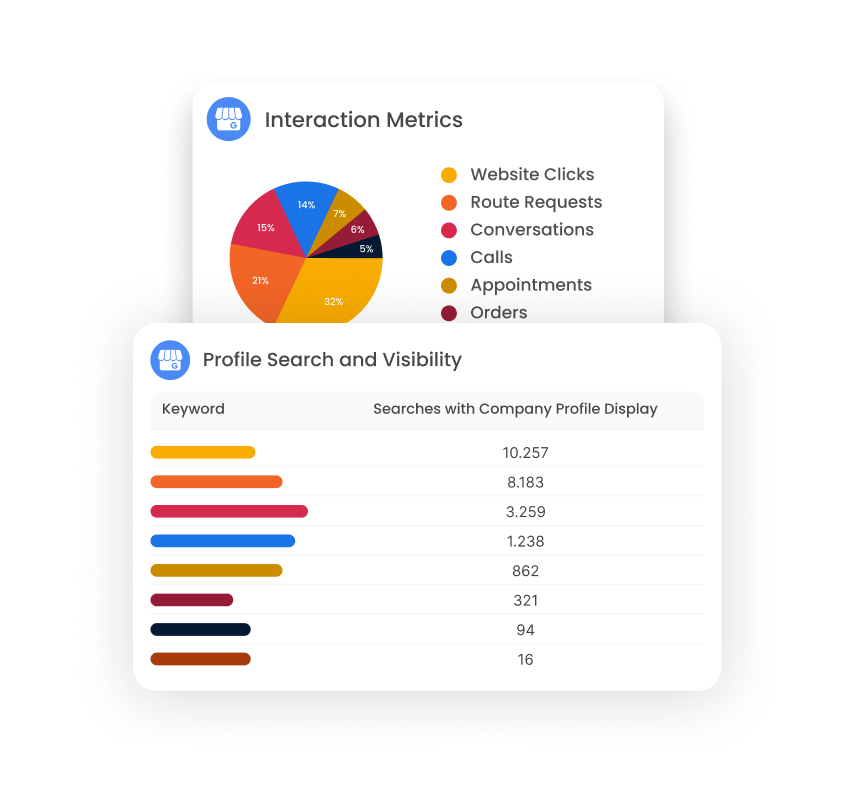
Google Maps (Desktop) Google Maps (Mobile) Google Search (Desktop) Google Search (Mobile) Searches with Business Profile Display Messages Ask for Directions Calls
Website Clicks Bookings Food orders Menus Total interactions Views Keyword Impressions
Official integrations
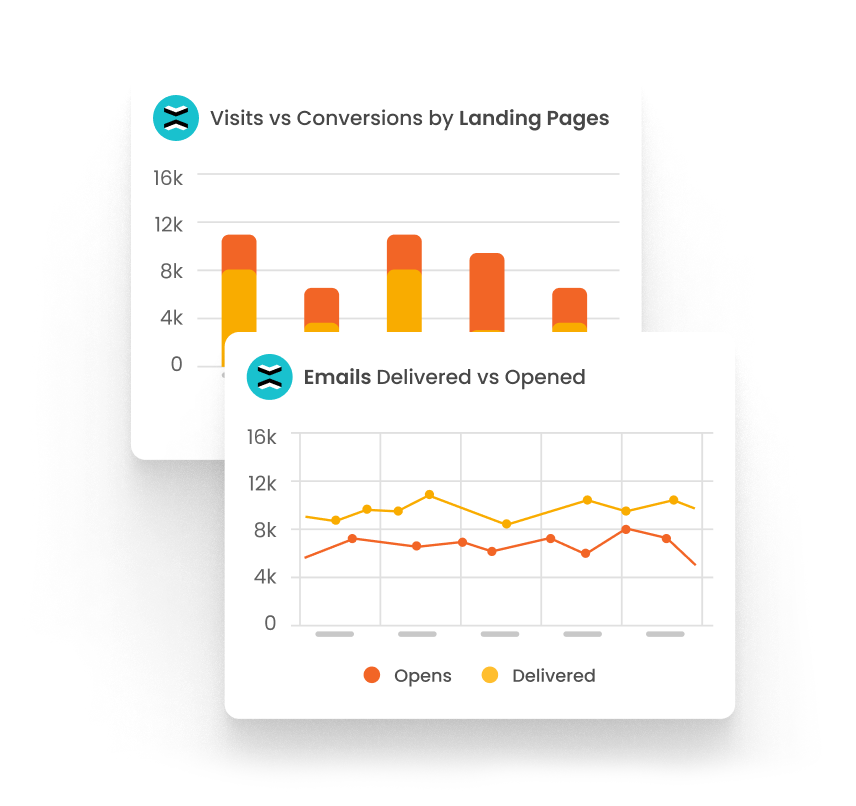
Hard bounce Delivered Opens Soft bounce Clicks Spam reports Unsubscribes Delivery rate Open rate Click rate Spam report rate Leads
Visitors* Sales* Funnel contacts* Qualified contacts* Opportunity*
Visits Leads Conversion rate
Hard bounce Delivered Opens Clicks Spam reports Unsubscribes Delivery rate Open rate Click rate Spam report rate

*Metrics available only for RD Station Advanced Plan Clients

Integrated spreadsheets: have the data you want, from anywhere!

Integrate your spreadsheets with mLabs Analytics and insert custom charts into your reports!

Import CSV spreadsheets, choose between line chart or column chart formats and ensure simple and intuitive analyses!
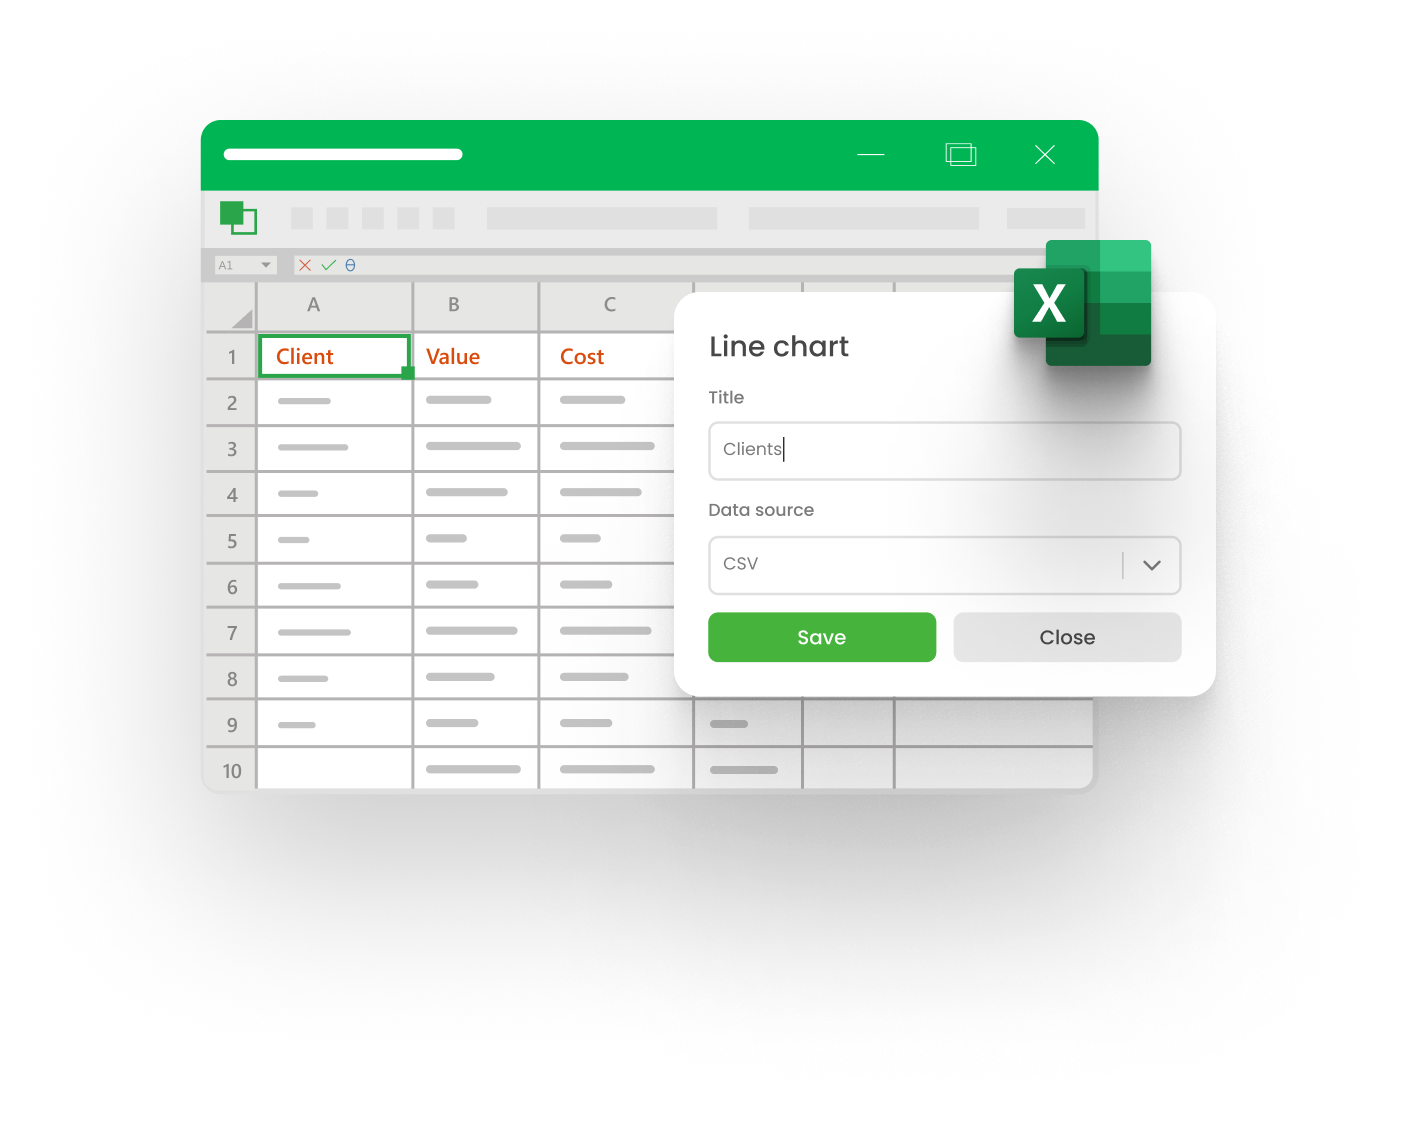
CSV Spreadsheet

Integrated spreadsheets: have the data you want, from anywhere!

CSV Spreadsheet

Integrate your spreadsheets with mLabs Analytics and insert custom charts into your reports!

Import CSV spreadsheets and choose the ideal format for presenting the information! Utilize ournumerous chart and table templates and ensure simple and intuitive analyses!

Reports and dashboards tailored to your client's needs!

integracoes icone 1

White label

Use our report templates and customize it with the colors and logo of your agency and your client! Just like reports, Dashboards can be customized!

Convide toda a sua equipe e clientes para a mLabs Analytics e defina os acessos que cada usuário deve ter. Ilimitado e sem custo adicional!

Unlimited

Generate as many reports as you need and invite as many users as you like to the platform, without paying extra for it! Report sending scheduling is also unlimited!

integracoes icone 2

Manual KPI

Another customization feature! Use Manual KPI to enrich your reports and dashboards by manually adding the metrics you desire!

integracoes icone 3

Client Portal

An exclusive and personalized website for your agency to share dashboards with clients. Deliver a unique data access experience, with login and password!

14 days of free trial

Take advantage and test all the mLabs Analytics resources with unlimited users, scheduling and reports!

14 days of free trial

Take advantage and test all the mLabs Analytics resources with unlimited users, scheduling and reports!

Official integrations:

14dias

We don’t need your card info. We don’t send Spam.